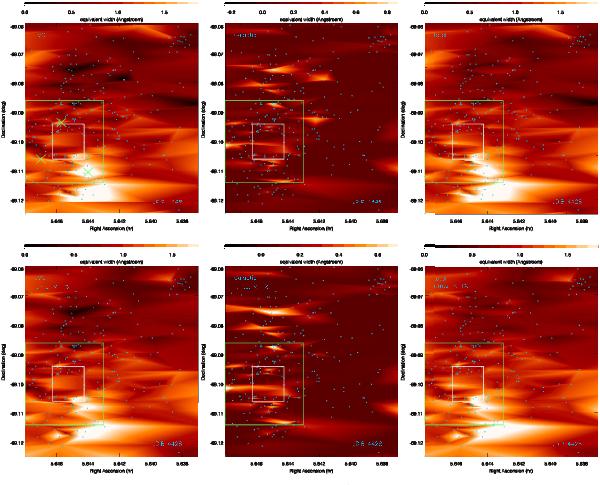
Fig. 5

As Fig. 4 but zoomed in on the densely sampled central region measuring 3.′5(RA) × 3.′9(Dec), which corresponds to 51 × 57 pc2 at the distance of the LMC. The white box delineates the area displayed in Fig. 8 (ARGUS spectra), while the green box delineates the area of the Na maps (Figs. 12 and 13). The green crosses mark three LMC clouds also seen in Na absorption (Fig. 12).
Current usage metrics show cumulative count of Article Views (full-text article views including HTML views, PDF and ePub downloads, according to the available data) and Abstracts Views on Vision4Press platform.
Data correspond to usage on the plateform after 2015. The current usage metrics is available 48-96 hours after online publication and is updated daily on week days.
Initial download of the metrics may take a while.


