Free Access
Fig. 3
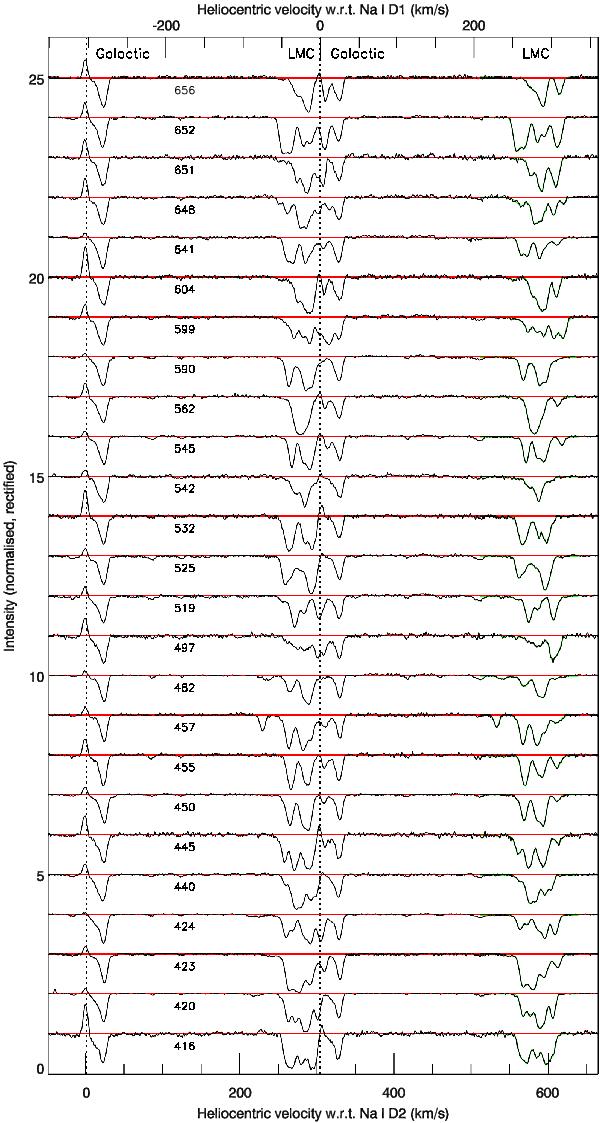
Normalised and rectified spectra of the Na i D doublet in the UVES spectra; each spectrum is offset from the one below by unity. The vertical dotted lines mark telluric emission at the rest wavelengths. Overplotted in green are the combined fits of ensembles of Gaussians to the D1 line centred between 5900.3–5902.2 Å.
Current usage metrics show cumulative count of Article Views (full-text article views including HTML views, PDF and ePub downloads, according to the available data) and Abstracts Views on Vision4Press platform.
Data correspond to usage on the plateform after 2015. The current usage metrics is available 48-96 hours after online publication and is updated daily on week days.
Initial download of the metrics may take a while.