Fig. 2
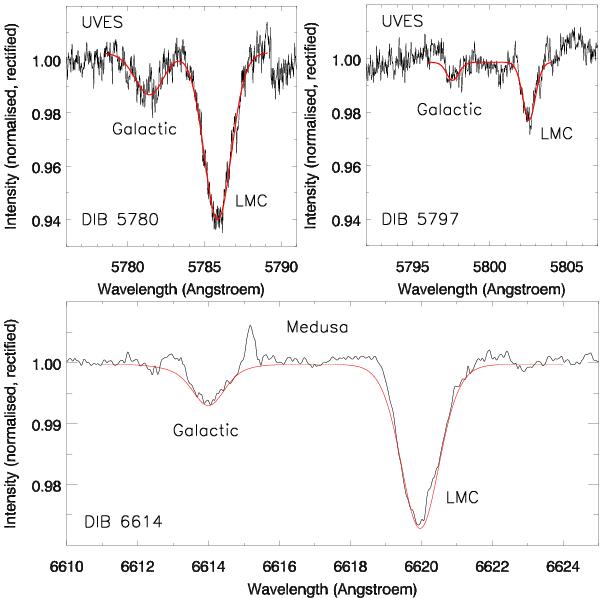
Normalised and rectified, rms(squared)-weighted average spectra of the (top left) 5780 and (top right) 5797 Å DIBs in the UVES sample and (bottom) 6614 Å DIB in the Medusa sample; with overplotted Gaussian profiles fit to the individual spectra. Spectra were included only if reasonable fits could be obtained (see Appendix A).
Current usage metrics show cumulative count of Article Views (full-text article views including HTML views, PDF and ePub downloads, according to the available data) and Abstracts Views on Vision4Press platform.
Data correspond to usage on the plateform after 2015. The current usage metrics is available 48-96 hours after online publication and is updated daily on week days.
Initial download of the metrics may take a while.