Fig. 12
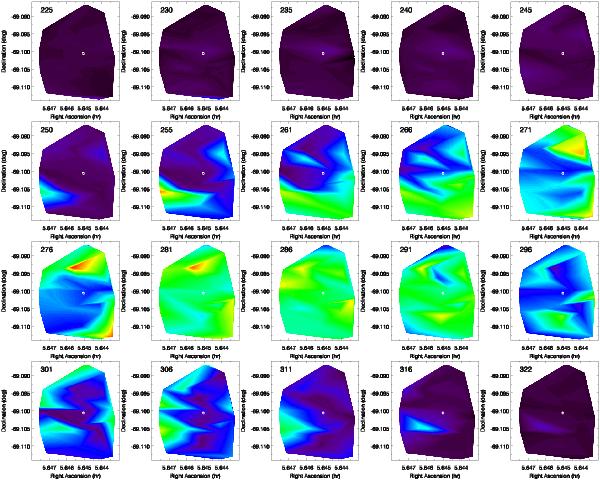
Velocity slices through the LMC component of the Na i D1 absorption in the UVES spectra, using a “rainbow” intensity scale (from black where there is no absorption, through purple/blue, then green/yellow, to red at the maximum detected absorption level). The centre velocity of each ~5 km s-1 wide slice is printed in each panel. The centre of R 136 is marked with a small white circle.
Current usage metrics show cumulative count of Article Views (full-text article views including HTML views, PDF and ePub downloads, according to the available data) and Abstracts Views on Vision4Press platform.
Data correspond to usage on the plateform after 2015. The current usage metrics is available 48-96 hours after online publication and is updated daily on week days.
Initial download of the metrics may take a while.