Fig. 10
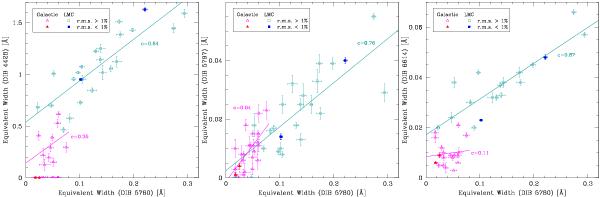
Correlation between the (left) 4428 Å DIB, (middle) 5797 Å DIB and (right) 6614 Å DIB on the one hand, and the 5780 Å DIB on the other. The Galactic component is plotted with open magenta triangles and the LMC component with open cyan squares; the best fits (with rms <1%) for both DIBs are highlighted in solid red triangles and solid blue squares for the Galactic and LMC components, respectively. Linear regression lines are overplotted, and annotated with the linear correlation coefficient.
Current usage metrics show cumulative count of Article Views (full-text article views including HTML views, PDF and ePub downloads, according to the available data) and Abstracts Views on Vision4Press platform.
Data correspond to usage on the plateform after 2015. The current usage metrics is available 48-96 hours after online publication and is updated daily on week days.
Initial download of the metrics may take a while.