Fig. 1
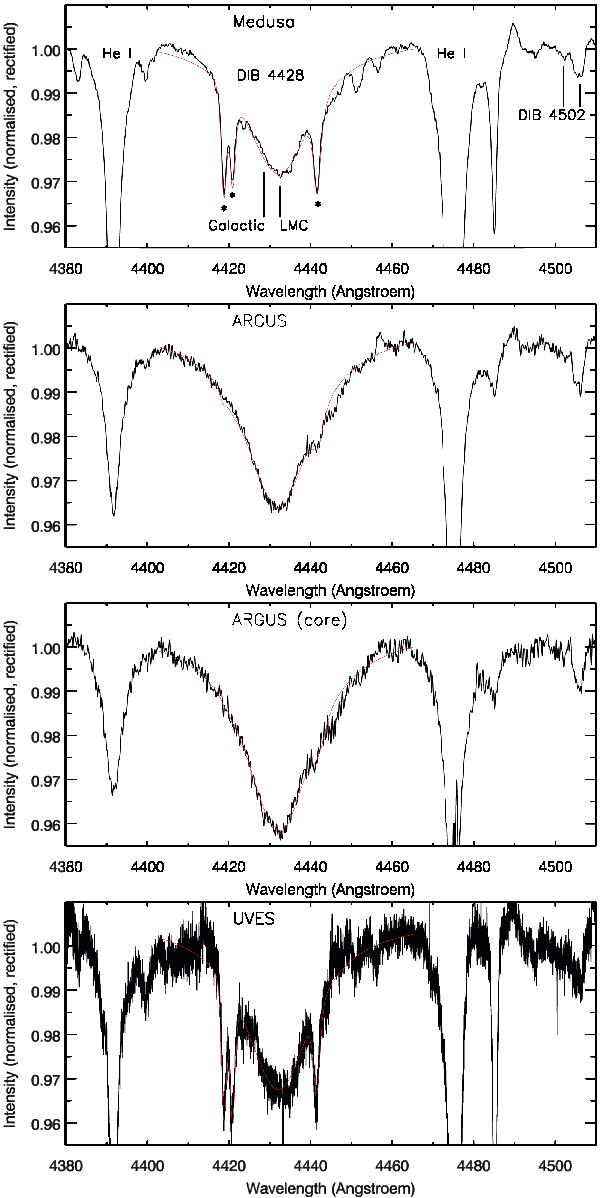
Normalised and rectified, rms(squared)-weighted average spectra of the 4428 Å DIB, with overplotted Lorentzian profiles fit to the individual spectra, in (from top to bottom) the Medusa sample; the ARGUS sample; the ARGUS spectrum of the unresolved core of R 136; the UVES sample. Three sharp stellar photospheric lines that were fit simultaneously with the DIB are marked with stars (see Appendix A). Spectra were included only if reasonable fits could be obtained.
Current usage metrics show cumulative count of Article Views (full-text article views including HTML views, PDF and ePub downloads, according to the available data) and Abstracts Views on Vision4Press platform.
Data correspond to usage on the plateform after 2015. The current usage metrics is available 48-96 hours after online publication and is updated daily on week days.
Initial download of the metrics may take a while.