Fig. 6
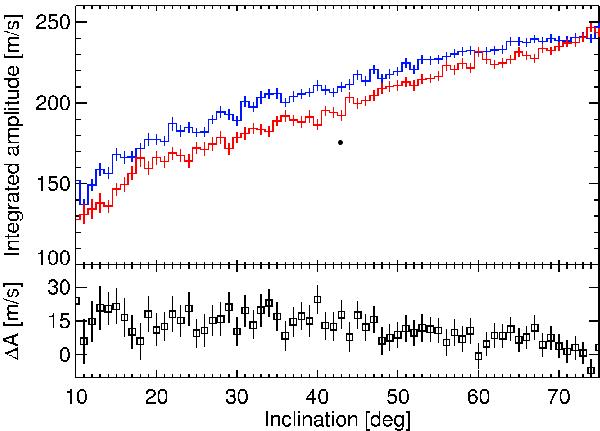
Upper panel:  and
and  versus θ in the range [10°,75°] . The blue line represents the average amplitude of the positive (trailing) polarity . The red line represents the average amplitude of the negative (leading) polarity after a remapping operation (θ → 180° − θ: ). Lower panel: ΔA versus θ (see the text). Vertical bars represent the errors, which were computed for each Aθ with the same method described in Sect. 3 and then summed up.
Current usage metrics show cumulative count of Article Views (full-text article views including HTML views, PDF and ePub downloads, according to the available data) and Abstracts Views on Vision4Press platform.
Data correspond to usage on the plateform after 2015. The current usage metrics is available 48-96 hours after online publication and is updated daily on week days.
Initial download of the metrics may take a while.