Free Access
Fig. 3
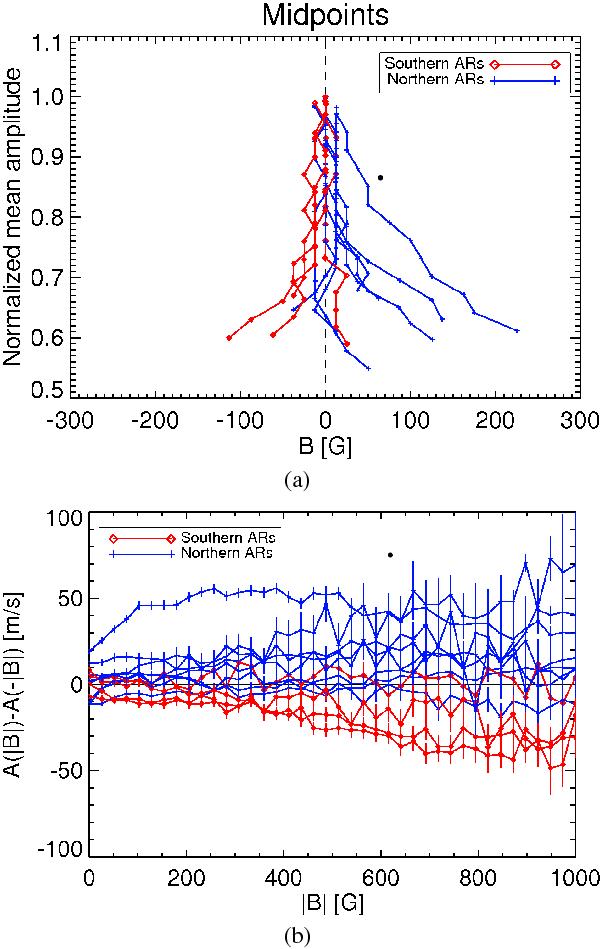
a) Midpoints for normalized velocity oscillation amplitude. b) Difference between oscillation amplitude for both polarities against the magnetic strength. Bars represent errors. Red line with diamonds refers to S βARs, blue line with plus signs to N βARs.
This figure is made of several images, please see below:
Current usage metrics show cumulative count of Article Views (full-text article views including HTML views, PDF and ePub downloads, according to the available data) and Abstracts Views on Vision4Press platform.
Data correspond to usage on the plateform after 2015. The current usage metrics is available 48-96 hours after online publication and is updated daily on week days.
Initial download of the metrics may take a while.