Fig. 7
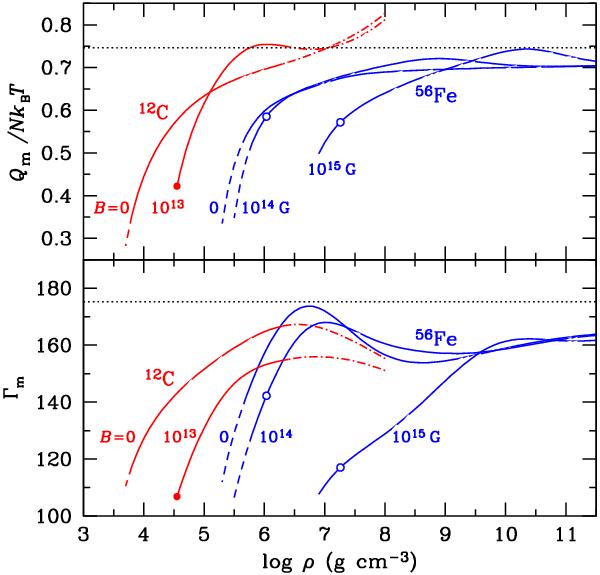
Characteristics of the melting transition of nonideal carbon and iron plasmas at different field strengths B (marked near the curves). Lower panel: the value Γm of the Coulomb coupling parameter Γ at the melting point as function of mass density ρ. Upper panel: normalized latent heat per ion at the melting transition. The dot-dashed and dashed segments of the curves correspond to the domains of nonperturbative quantum effects (T < 0.5 Tp) and electron response (Z2 Ry > 0.1 ϵF), respectively. The dotted horizontal lines mark the OCP values. The filled and open circles mark the positions of the real and virtual condensed surfaces (see text in Sect. 7.3).
Current usage metrics show cumulative count of Article Views (full-text article views including HTML views, PDF and ePub downloads, according to the available data) and Abstracts Views on Vision4Press platform.
Data correspond to usage on the plateform after 2015. The current usage metrics is available 48-96 hours after online publication and is updated daily on week days.
Initial download of the metrics may take a while.