Fig.7
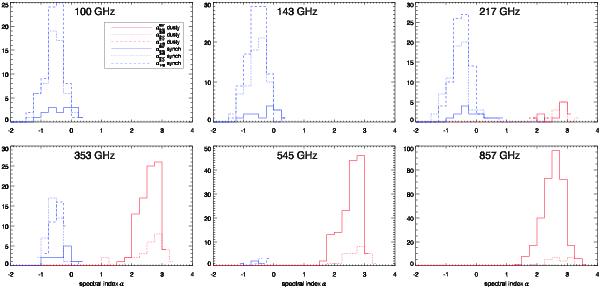
Distribution of spectral indices (for the sources present in the ERCSC at a given
frequency in our sample with completeness of 80% or above). Here
 is shown as a dotted line,
 as a dashed line, and
 as a solid line. The region
2 ≤ α ≤ 4 is typical of thermal dust emission. In red we show the
dusty sources, whereas in blue we show the synchrotron sources. The sources in all
three samples (deep, medium, and shallow) are combined here. Note that, as expected,
the 100 GHz, and 143 GHz samples are dominated by radio galaxies, whereas the
545 GHz and 857 GHz samples are dominated by dusty galaxies. At 217 GHz and 353 GHz
we observe the transition between the two populations, with significant numbers of
both types being present in the samples.
as a solid line. The region
2 ≤ α ≤ 4 is typical of thermal dust emission. In red we show the
dusty sources, whereas in blue we show the synchrotron sources. The sources in all
three samples (deep, medium, and shallow) are combined here. Note that, as expected,
the 100 GHz, and 143 GHz samples are dominated by radio galaxies, whereas the
545 GHz and 857 GHz samples are dominated by dusty galaxies. At 217 GHz and 353 GHz
we observe the transition between the two populations, with significant numbers of
both types being present in the samples.
Current usage metrics show cumulative count of Article Views (full-text article views including HTML views, PDF and ePub downloads, according to the available data) and Abstracts Views on Vision4Press platform.
Data correspond to usage on the plateform after 2015. The current usage metrics is available 48-96 hours after online publication and is updated daily on week days.
Initial download of the metrics may take a while.