Fig.A.2
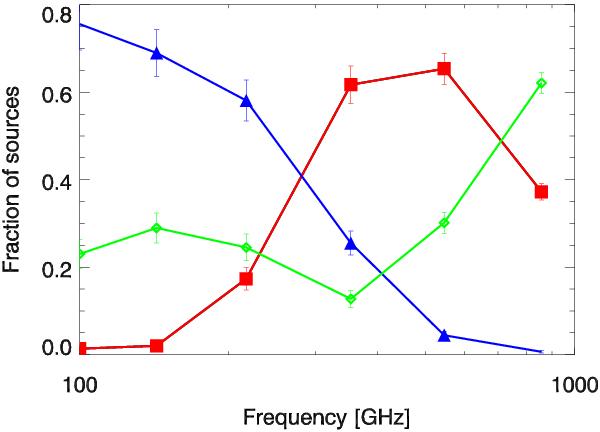
Like Fig. A.1, the fraction of source type (dusty, red squares; synchrotron, blue triangles; green diamonds, intermediate) as a function of frequency. The difference is that we have now included the whole catalogue, i.e. including sources affected by more photometric noise below the 80% completeness limit cut. The effect of increasing noise is to induce more sources to be classified as intermediate.
Current usage metrics show cumulative count of Article Views (full-text article views including HTML views, PDF and ePub downloads, according to the available data) and Abstracts Views on Vision4Press platform.
Data correspond to usage on the plateform after 2015. The current usage metrics is available 48-96 hours after online publication and is updated daily on week days.
Initial download of the metrics may take a while.