Free Access
Fig. 4
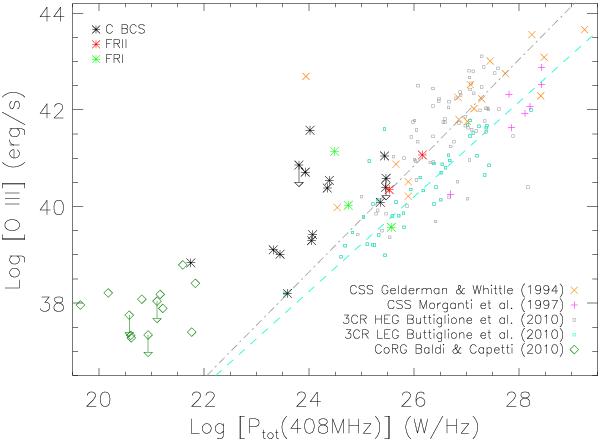
Correlation of the total radio power at 408 MHz vs. the [O III] emission line intensities produced by the narrow line regions. The two dashed lines represent the best linear fit obtained for the HEG and the LEG sub-populations separately (according to Buttiglione et al. 2010). See text for more details.
Current usage metrics show cumulative count of Article Views (full-text article views including HTML views, PDF and ePub downloads, according to the available data) and Abstracts Views on Vision4Press platform.
Data correspond to usage on the plateform after 2015. The current usage metrics is available 48-96 hours after online publication and is updated daily on week days.
Initial download of the metrics may take a while.