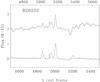
Fig. 2
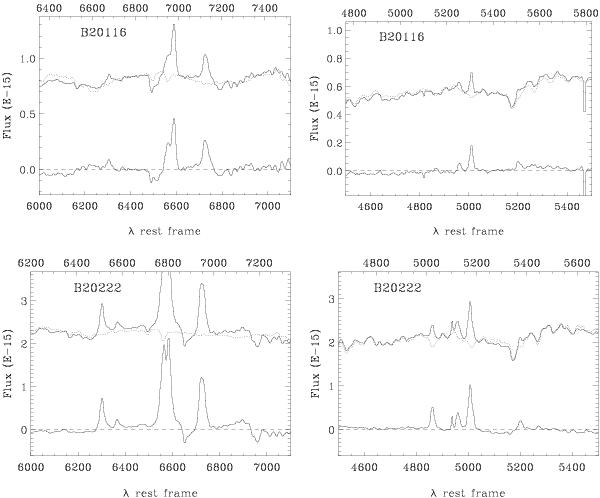
Spectra of two C BCSs after the subtraction of the single stellar population model with the best fit. The first column represents the modeling centered on the Hα line, while the second column shows the fits for the Hβ line. In all panels, the C BCS spectra are depicted in solid lines, the top spectra show the status before the stellar removal and the bottom spectra are the results of the host galaxy stellar population subtraction. The dotted line through the top spectra indicates the best-fit single stellar population model. The dashed line across the bottom spectra indicates the zero flux level.
Current usage metrics show cumulative count of Article Views (full-text article views including HTML views, PDF and ePub downloads, according to the available data) and Abstracts Views on Vision4Press platform.
Data correspond to usage on the plateform after 2015. The current usage metrics is available 48-96 hours after online publication and is updated daily on week days.
Initial download of the metrics may take a while.