Free Access
Fig. 12
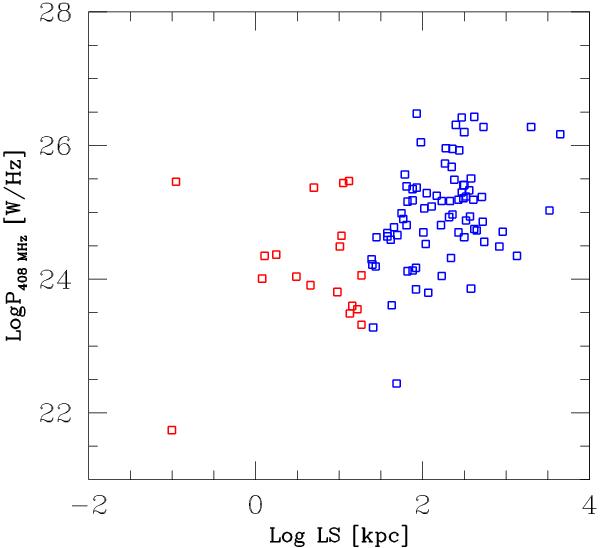
Radio power vs. linear size diagram for sources in the BCS (Giovannini et al. 2005). The red squares indicate C BCS sources, while the blue ones represent the remaining extended objects.
Current usage metrics show cumulative count of Article Views (full-text article views including HTML views, PDF and ePub downloads, according to the available data) and Abstracts Views on Vision4Press platform.
Data correspond to usage on the plateform after 2015. The current usage metrics is available 48-96 hours after online publication and is updated daily on week days.
Initial download of the metrics may take a while.