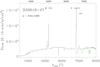
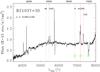
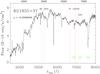
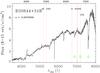
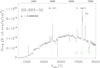
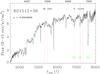
Fig. 1
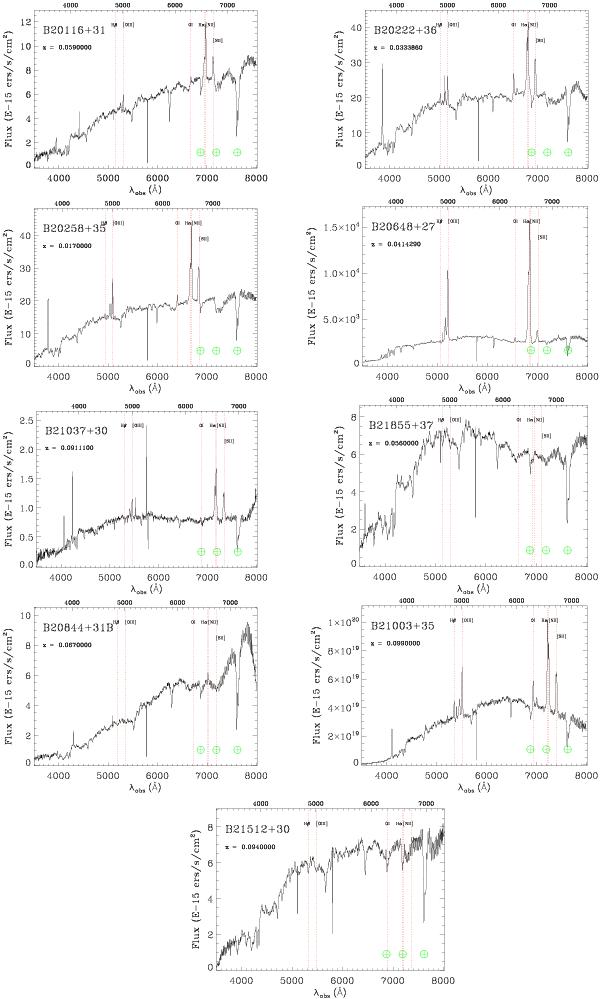
Optical spectra of our TNG targets. These spectra are extracted from the central 1.65 arcsec of the galaxies. The fluxes are in units of 10-15 erg s-1 cm-2. The red dotted vertical lines indicate the position of the main optical emission lines, while the green crossed circles on the bottom of the spectra indicate the position of the main telluric absorption lines. On the upper left side of the spectra the source redshift is indicated below the target name.
Current usage metrics show cumulative count of Article Views (full-text article views including HTML views, PDF and ePub downloads, according to the available data) and Abstracts Views on Vision4Press platform.
Data correspond to usage on the plateform after 2015. The current usage metrics is available 48-96 hours after online publication and is updated daily on week days.
Initial download of the metrics may take a while.