Fig. 9
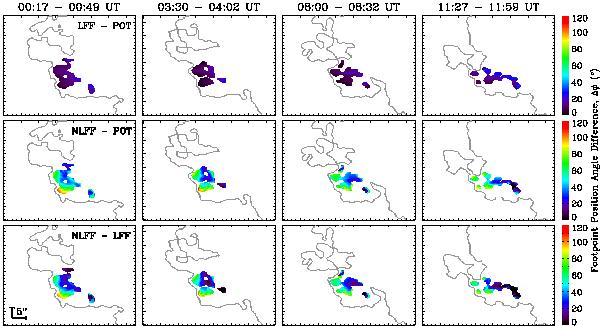
Spatial variation of footpoint position angle difference, Δφ, from originating ROI pixel locations (see Fig. 10 for value distributions). Scan time increases from left to right, while rows depict values of ΔφLFF−POT (upper), ΔφNLFF−POT (middle), and ΔφNLFF−LFF (lower). A neutral line is plotted in grey for context, as seen in the lower row of Fig. 1.
Current usage metrics show cumulative count of Article Views (full-text article views including HTML views, PDF and ePub downloads, according to the available data) and Abstracts Views on Vision4Press platform.
Data correspond to usage on the plateform after 2015. The current usage metrics is available 48-96 hours after online publication and is updated daily on week days.
Initial download of the metrics may take a while.