Fig. 8
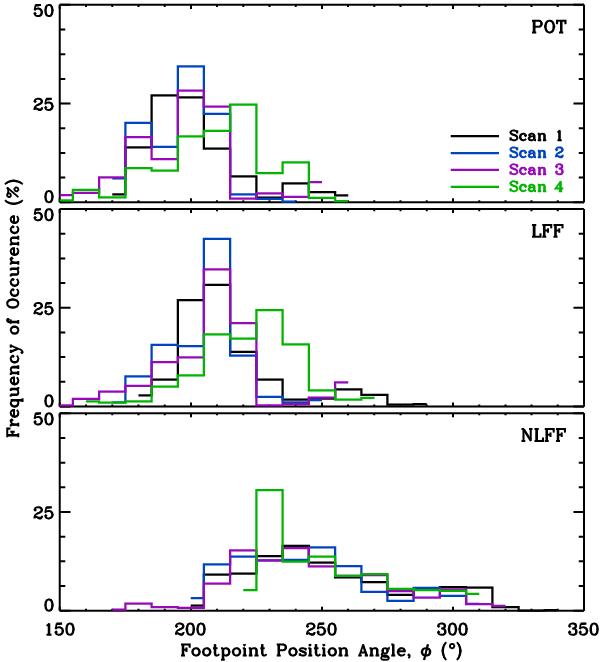
Distribution of footpoint position angles from all ROI pixels for potential (upper), LFF (middle), and NLFF (lower) extrapolations. Y-axes show percentage occurrences, while the x-axis gives the end footpoint position angle in degrees counter-clockwise from Solar West. Each scan distribution is coloured as per the legend, while bin sizes of 10° were used throughout.
Current usage metrics show cumulative count of Article Views (full-text article views including HTML views, PDF and ePub downloads, according to the available data) and Abstracts Views on Vision4Press platform.
Data correspond to usage on the plateform after 2015. The current usage metrics is available 48-96 hours after online publication and is updated daily on week days.
Initial download of the metrics may take a while.