Free Access
Fig. 7
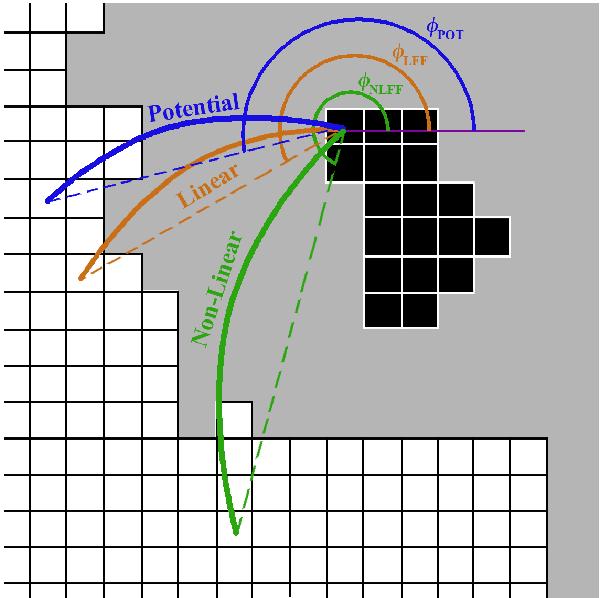
Cartoon of typical extrapolated field line traces. The black area indicates the negative polarity ROI, and white area the plage region. The grids outline single pixels. Field-line traces and position angles are indicated in blue (potential), orange (LFF), and green (NLFF).
Current usage metrics show cumulative count of Article Views (full-text article views including HTML views, PDF and ePub downloads, according to the available data) and Abstracts Views on Vision4Press platform.
Data correspond to usage on the plateform after 2015. The current usage metrics is available 48-96 hours after online publication and is updated daily on week days.
Initial download of the metrics may take a while.