Free Access
Fig. 2
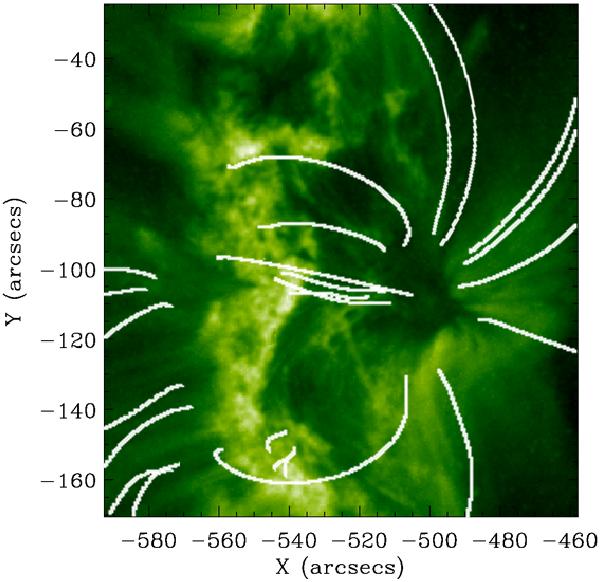
TRACE 195 Å log-scale image of NOAA active region 10953 at 03:45 UT on 29 April 2007. The overplotted white lines represent selected field lines from NLFF extrapolation results of scan 2.
Current usage metrics show cumulative count of Article Views (full-text article views including HTML views, PDF and ePub downloads, according to the available data) and Abstracts Views on Vision4Press platform.
Data correspond to usage on the plateform after 2015. The current usage metrics is available 48-96 hours after online publication and is updated daily on week days.
Initial download of the metrics may take a while.