Fig. 1
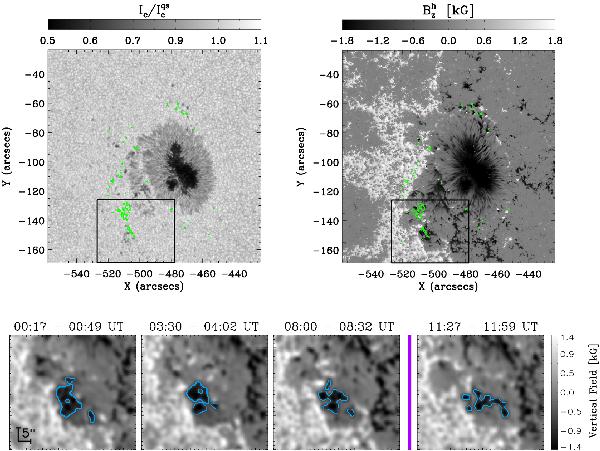
Upper row shows the active region pre-flare state in continuum intensity (left) and vertical field strength (right). Green contours overlaid on both images indicate Ca ii H flare brightening observed at flare peak. The ~ 50″ × 40″ sub-region indicated by the black box in the upper row is shown in the lower row as preprocessed vertical field strength, at increasing scan time from left to right. A region of interest, thresholded at − 750 G, is defined by the blue contours, and the purple line indicates the time of flaring between scans 3 and 4.
Current usage metrics show cumulative count of Article Views (full-text article views including HTML views, PDF and ePub downloads, according to the available data) and Abstracts Views on Vision4Press platform.
Data correspond to usage on the plateform after 2015. The current usage metrics is available 48-96 hours after online publication and is updated daily on week days.
Initial download of the metrics may take a while.