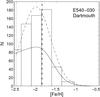
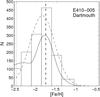
Fig. 12
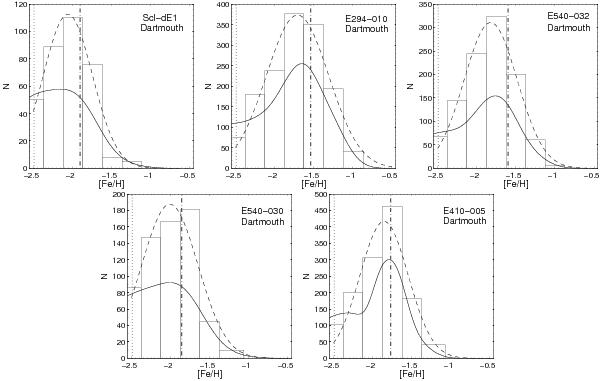
MDFs for our dwarf galaxy sample. The solid lines result from convolving the histograms with the errors of the individual measurements, and the dashed lines show the fitted Gaussian distributions. The vertical dotted-dashed lines indicate the value of the error-weighted mean metallicity, while the dotted vertical line show the most metal-poor value of the isochrone used in the interpolation. The MDFs were derived using Dartmouth isochrones and the assumption of a single old age for the upper RGB stars. Each dwarf’s MDF is constructed using the stars that lie redder than the bluest, most metal-poor isochrone and that are within the selection box described in Sect. 5.
Current usage metrics show cumulative count of Article Views (full-text article views including HTML views, PDF and ePub downloads, according to the available data) and Abstracts Views on Vision4Press platform.
Data correspond to usage on the plateform after 2015. The current usage metrics is available 48-96 hours after online publication and is updated daily on week days.
Initial download of the metrics may take a while.