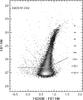
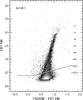
Fig. 3
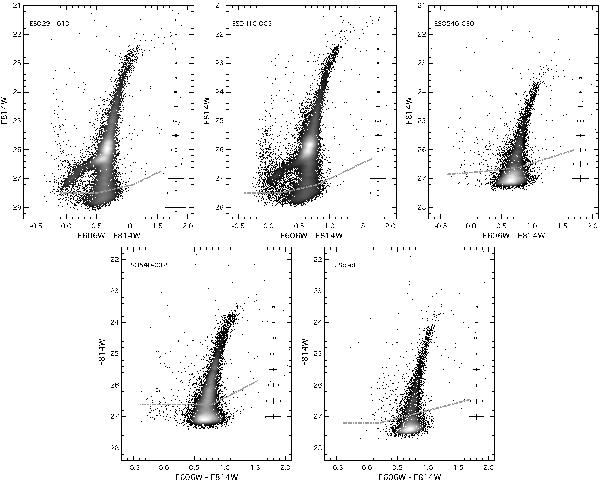
CMDs for the five Sculptor group dwarfs with stellar density maps overlaid to emphasise the high stellar density features. The error bars on the red part of the CMD correspond to the photometric errors as derived from artificial star tests. The grey dotted line indicates the 50% completeness factors as a function of color and magnitude.
Current usage metrics show cumulative count of Article Views (full-text article views including HTML views, PDF and ePub downloads, according to the available data) and Abstracts Views on Vision4Press platform.
Data correspond to usage on the plateform after 2015. The current usage metrics is available 48-96 hours after online publication and is updated daily on week days.
Initial download of the metrics may take a while.