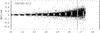
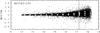
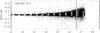
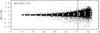
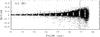
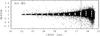
Fig. 2
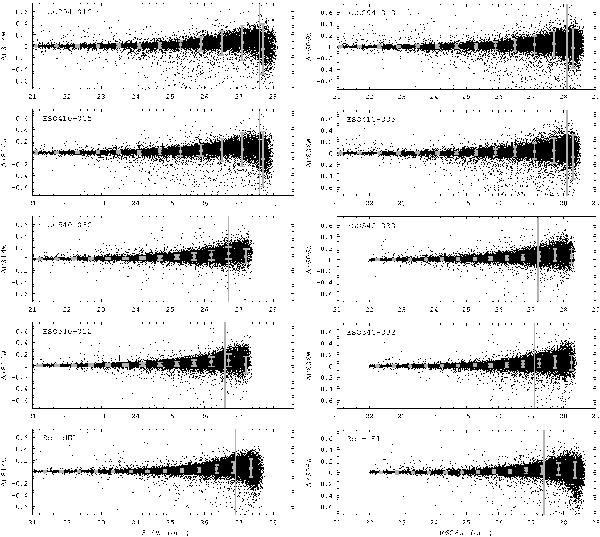
Photometric errors derived from the artificial star tests. The panels show the difference between output and input magnitudes as a function of the output magnitude (left panels: F814W-band; right panels: F606W-band). The vertical gray line indicates the magnitude corresponding to the 50% completeness factors, while the gray error bars show the mean magnitude difference as a function of the output magnitude.

Current usage metrics show cumulative count of Article Views (full-text article views including HTML views, PDF and ePub downloads, according to the available data) and Abstracts Views on Vision4Press platform.
Data correspond to usage on the plateform after 2015. The current usage metrics is available 48-96 hours after online publication and is updated daily on week days.
Initial download of the metrics may take a while.