Fig. 13
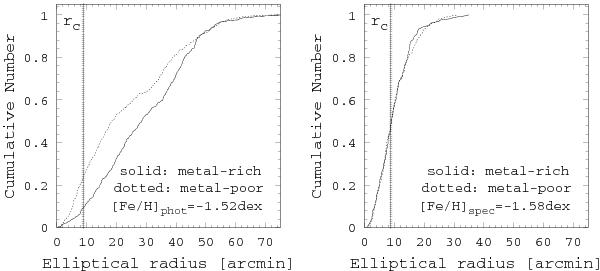
Left panel: cumulative metallicity distribution functions based on photometric metallicities for the Carina dSph. Right panel: the same as in the left panel, but based on spectroscopic metallicities. The cumulative distributions are separated according to values higher or lower than the median metallicity, indicated within each panel. In both cases, the vertical line indicates the location of the core radius, rc, from Irwin & Hatzidimitriou (1995).
Current usage metrics show cumulative count of Article Views (full-text article views including HTML views, PDF and ePub downloads, according to the available data) and Abstracts Views on Vision4Press platform.
Data correspond to usage on the plateform after 2015. The current usage metrics is available 48-96 hours after online publication and is updated daily on week days.
Initial download of the metrics may take a while.