Fig. 12
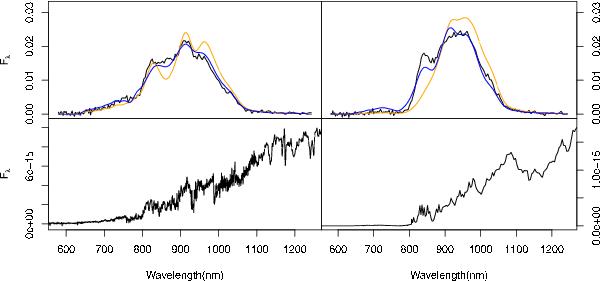
(Top panel, black continuous lines) GOG simulations of spectra contained in the Legget compilation corresponding to 2MASS0345 + 25 (left) and SDSS1511 + 06 (right) for G = 20 and 70 transits. The blue line represents in both panels the model corresponding to the mode of the posterior probability as derived using ellipsoidal sampling. In orange, the model that corresponds to the effective temperature derived from the spectral type (L1 and T0 respectively) using the SLC calibration. The lower row shows the original spectra completed with the best χ2 model.
Current usage metrics show cumulative count of Article Views (full-text article views including HTML views, PDF and ePub downloads, according to the available data) and Abstracts Views on Vision4Press platform.
Data correspond to usage on the plateform after 2015. The current usage metrics is available 48-96 hours after online publication and is updated daily on week days.
Initial download of the metrics may take a while.