Fig. 1
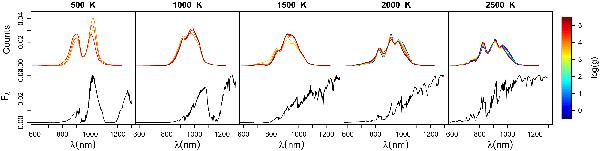
Normalised sample spectra from the BT-Settl library. The top row shows simulated Gaia RP spectra of BT-Settl models for Teff = 500, 1000, 1500, 2000, and 2500 K. The vertical axis is proportional to the number of photons detected in each wavelength bin. The line colours reflect the various values of log (g) available in the library of models according to the colour scale on the right. The bottom row shows the original spectra with the same temperatures as in the top row, log (g) = 5.0 and solar metallicity.
Current usage metrics show cumulative count of Article Views (full-text article views including HTML views, PDF and ePub downloads, according to the available data) and Abstracts Views on Vision4Press platform.
Data correspond to usage on the plateform after 2015. The current usage metrics is available 48-96 hours after online publication and is updated daily on week days.
Initial download of the metrics may take a while.