Free Access
Fig. A.1
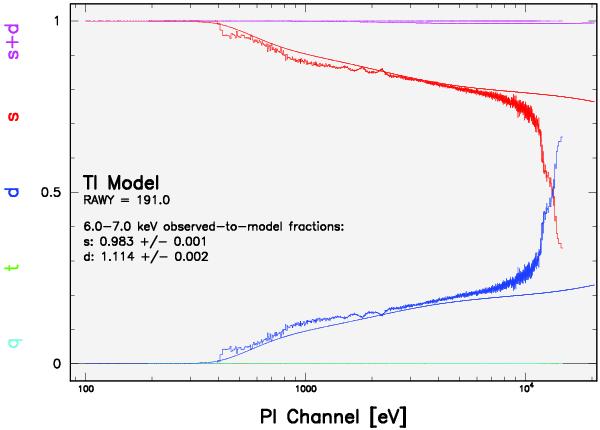
Estimation of the pile-up fraction in the EPIC-pn through the epatplot tool at the 6−7 keV iron line energy range when all the columns of the CCD are considered. The plot represents the spectra of the single (red) and double (blue) events. Solid lines indicate the expected fraction from the model curves.
Current usage metrics show cumulative count of Article Views (full-text article views including HTML views, PDF and ePub downloads, according to the available data) and Abstracts Views on Vision4Press platform.
Data correspond to usage on the plateform after 2015. The current usage metrics is available 48-96 hours after online publication and is updated daily on week days.
Initial download of the metrics may take a while.