Fig. 5
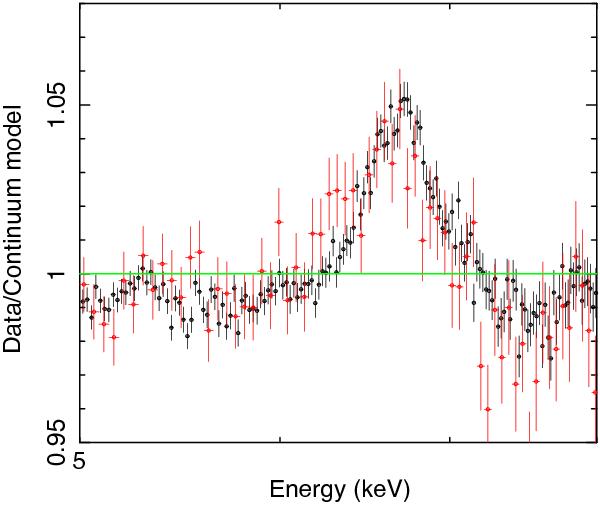
Ratio of the data to the continuum model for XMM/EPIC-pn (black) and BeppoSAX/MECS (red) in the energy range 5−8 keV showing the broad iron line clearly visible in both spectra, although the statistics are much better in the case of the pn spectrum. The continuum is described by the spectral model phabs (bbody + compTT) in Xspec.
Current usage metrics show cumulative count of Article Views (full-text article views including HTML views, PDF and ePub downloads, according to the available data) and Abstracts Views on Vision4Press platform.
Data correspond to usage on the plateform after 2015. The current usage metrics is available 48-96 hours after online publication and is updated daily on week days.
Initial download of the metrics may take a while.