Fig.2
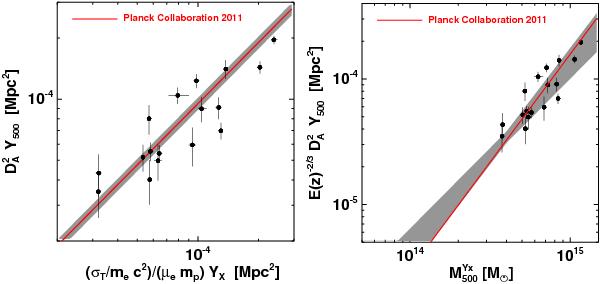
Comparison of present SZ flux measurements to our previous results. Quantities are
measured within the R500 derived from weak lensing.
Left panel: relation between
 and
CXSZYX,500 = Mg,500 TX,
where TX is the spectroscopic temperature in the
[0.15−0.75] R500 region. The grey shaded region is
the best-fitting power-law relation obtained with slope fixed to 1; the red line
shows the results from our previous analysis of 62 local systems (Planck Collaboration 2011f). Right
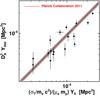
panel: correlation between and
and
CXSZYX,500 = Mg,500 TX,
where TX is the spectroscopic temperature in the
[0.15−0.75] R500 region. The grey shaded region is
the best-fitting power-law relation obtained with slope fixed to 1; the red line
shows the results from our previous analysis of 62 local systems (Planck Collaboration 2011f). Right
panel: correlation between and
 derived from the relation of Arnaud et al. (2010), compared to the results from
Planck Collaboration (2011f). The shaded
region illustrates the best-fitting BCES orthogonal regression and associated
± 1σ uncertainties.
derived from the relation of Arnaud et al. (2010), compared to the results from
Planck Collaboration (2011f). The shaded
region illustrates the best-fitting BCES orthogonal regression and associated
± 1σ uncertainties.
Current usage metrics show cumulative count of Article Views (full-text article views including HTML views, PDF and ePub downloads, according to the available data) and Abstracts Views on Vision4Press platform.
Data correspond to usage on the plateform after 2015. The current usage metrics is available 48-96 hours after online publication and is updated daily on week days.
Initial download of the metrics may take a while.