Fig. 8
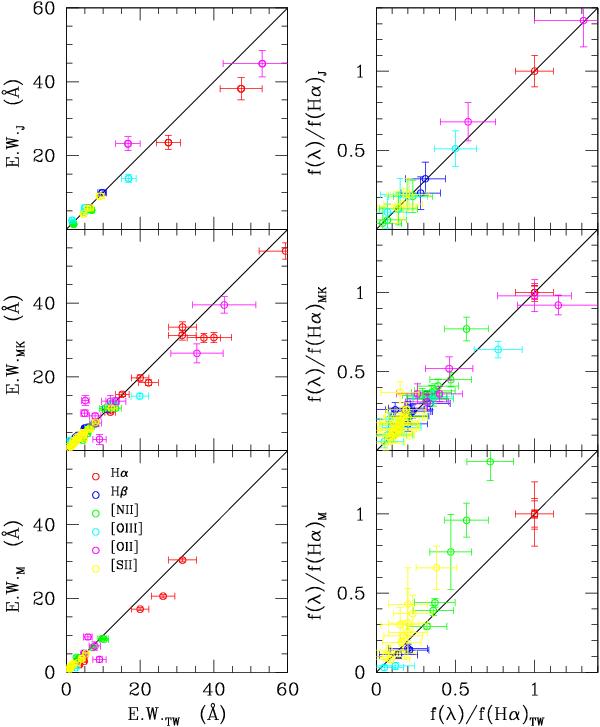
The comparison between the equivalent width (left) and the normalised flux (right) of the main emission lines measured in this work (TW) with those available in the literature from Jansen et al. (2000; J; upper panel), Moustakas & Kennicutt (2006; MK; middle panel), and Moustakas et al. (2010; M; lower panel). Different colour codes are used for the different emission lines: red symbols for Hα; blue for Hβ, green for [Nii]6548 and [Nii]6584 Å, cyan for [Oiii] and 5007 Å, magenta for [Oii] 3727 Å, and yellow for [Sii] 6717 and 6731 Å (the two lines composing a doublet are plotted with the same symbol). The solid line shows the 1:1 relationship.
Current usage metrics show cumulative count of Article Views (full-text article views including HTML views, PDF and ePub downloads, according to the available data) and Abstracts Views on Vision4Press platform.
Data correspond to usage on the plateform after 2015. The current usage metrics is available 48-96 hours after online publication and is updated daily on week days.
Initial download of the metrics may take a while.