Fig. 7
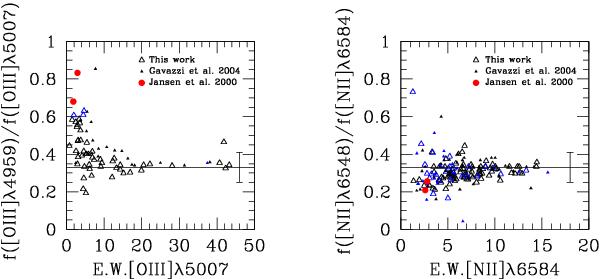
The relationship between the [Oiii]λ4959/[Oiii]λ5007 flux line ratio and the equivalent width of [Oiii]λ5007 (left) and of the [Nii]λ6548/[Nii]λ6584 flux line ratio and the equivalent width of [Nii]λ6584 (right). The solid line gives the theoretical value (1/3). Empty triangles are for galaxies observed in this work, filled triangles for those presented in Gavazzi et al. (2004), red dots for objects in Jansen et al. (2000). Galaxies hosting an AGN are marked with a blue symbol. The vertical line indicates a 18% error in the flux line emission line.
Current usage metrics show cumulative count of Article Views (full-text article views including HTML views, PDF and ePub downloads, according to the available data) and Abstracts Views on Vision4Press platform.
Data correspond to usage on the plateform after 2015. The current usage metrics is available 48-96 hours after online publication and is updated daily on week days.
Initial download of the metrics may take a while.