Fig. 5
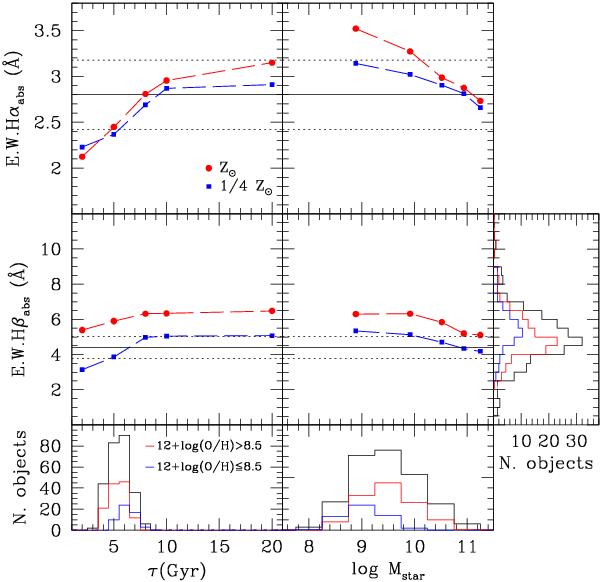
Variation of the equivalent width of the Hα (upper panel) and Hβ (middle panel) Balmer absorption lines, in Å, predicted by the MILES population synthesis models, as a function of the delayed exponentially declining time scale τ for a Sandage law (left) and of the stellar mass for the Boissier & Prantzos (2000) chemo-spectrophotometric models of galaxy secular evolution (right). The red line is for solar metallicities, the blue one for Z = 1 / 4 Z ⊙ . The Balmer absorption lines are measured for five different τ (2, 5, 8, 10, 20 Gyr) and stellar masses (log Mstar = 8.89, 9.92, 10.52, 10.94, 11.25 M ⊙ ). The horizontal solid and dotted lines give the mean value ± the standard deviation of EW Hαabs (2.8 ± 0.38 Å) and EW Hβabs (4.4 ± 0.63 Å) of Moustakas & Kennicutt (2006) for their sample of galaxies. The lower panel gives the expected distribution of τ and Mstar for the late-type HRS galaxies analysed in this work. The values of τ are estimated using the τ – LH luminosity relation given in Gavazzi et al. (2002a,b): log τ = − 0.149 × log LH + 2.221. The blue and red histograms give the observed distribution of HRS galaxies with metallicity 12 + log(O/H) ≤ 8.5 and 12 + log(O/H) > 8.5, respectively. The right histogram in the middle row shows the distribution of the observed underlying Balmer absorption at Hβ for the whole s ample (black) and for metal poor (blue) and metal rich (red) galaxies.
Current usage metrics show cumulative count of Article Views (full-text article views including HTML views, PDF and ePub downloads, according to the available data) and Abstracts Views on Vision4Press platform.
Data correspond to usage on the plateform after 2015. The current usage metrics is available 48-96 hours after online publication and is updated daily on week days.
Initial download of the metrics may take a while.