Fig. 4
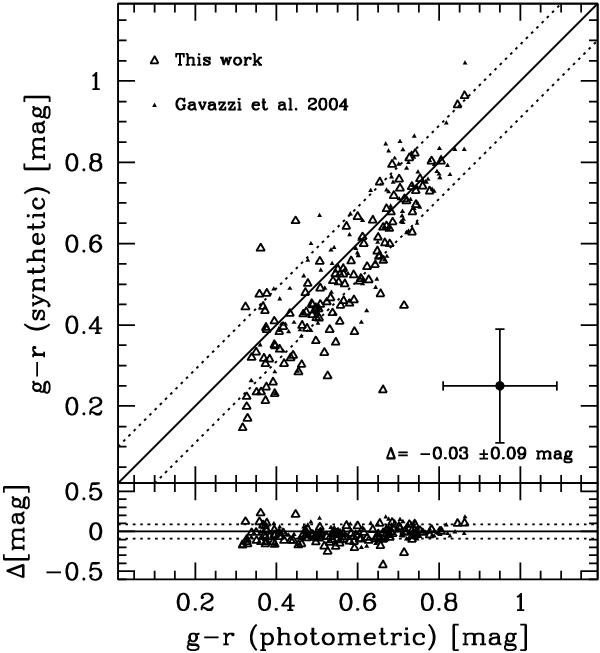
Comparison between the photometric and the spectroscopic g − r colours for galaxies observed in this work (empty triangles) and in Gavazzi et al. (2004) (filled triangles). The solid line gives the 1:1 relationship and the dotted lines the 1 sigma uncertainty. The cross indicates a typical error bar of 0.14 mag on the colour, corresponding to ∼ 10% uncertainty in each band.
Current usage metrics show cumulative count of Article Views (full-text article views including HTML views, PDF and ePub downloads, according to the available data) and Abstracts Views on Vision4Press platform.
Data correspond to usage on the plateform after 2015. The current usage metrics is available 48-96 hours after online publication and is updated daily on week days.
Initial download of the metrics may take a while.