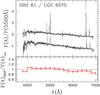
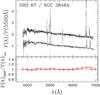
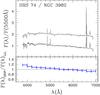
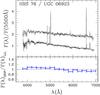
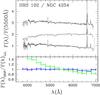
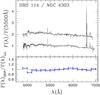
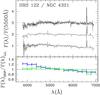
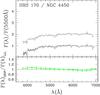
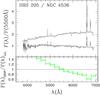
Fig. 3
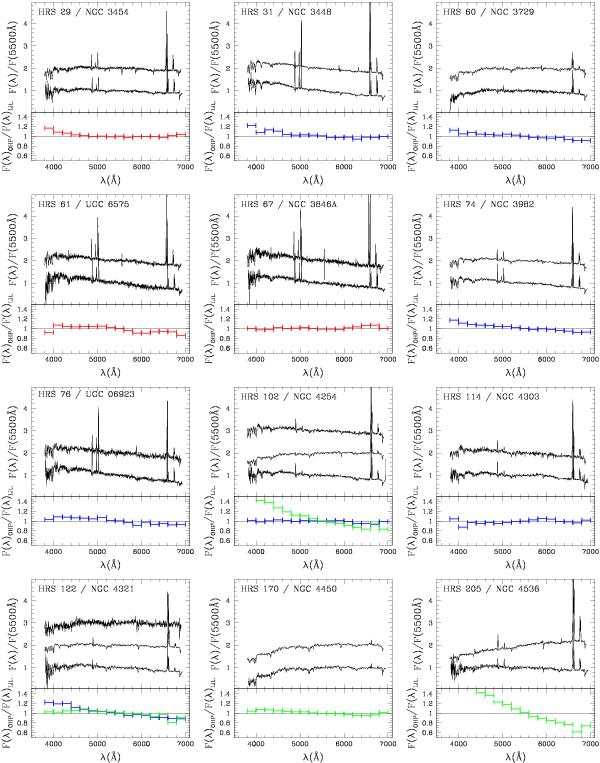
Comparison between the spectra of galaxies observed in this work or in Gavazzi et al. (2004) (lower spectra) and with data available in the literature (upper spectra). The ratio of the different spectra is given in the lower panel, in bins 200 Å wide. Different colour codes are used when data are from Moustakas et al. (2010) (green), Moustakas & Kennicutt (2006) (blue), and Jansen et al. (2000) (red). Whenever two independent spectra are available in the literature (HRS 102, 122 and 217), they are given from top to bottom following the order Moustakas & Kennicutt (2006), Moustakas et al. (2010), this work, or Gavazzi et al. (2004).
Current usage metrics show cumulative count of Article Views (full-text article views including HTML views, PDF and ePub downloads, according to the available data) and Abstracts Views on Vision4Press platform.
Data correspond to usage on the plateform after 2015. The current usage metrics is available 48-96 hours after online publication and is updated daily on week days.
Initial download of the metrics may take a while.