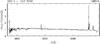
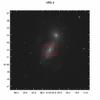
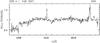
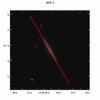
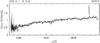
Fig. 19
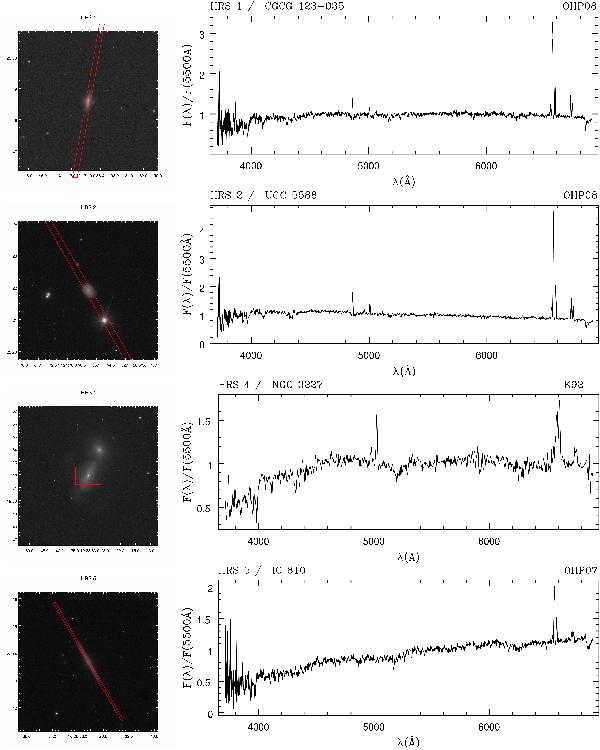
Integrated spectral atlas of the HRS galaxies, in order of increasing HRS name. Left: the r band SDSS image of the observed galaxies with overimposed the position covered by the slit during the observations (red solid line). Right: observed spectra normalised to their mean intensity between λ = 5400 − 5600 Å. The full atlas is available in electronic format on the HeDaM database.
Current usage metrics show cumulative count of Article Views (full-text article views including HTML views, PDF and ePub downloads, according to the available data) and Abstracts Views on Vision4Press platform.
Data correspond to usage on the plateform after 2015. The current usage metrics is available 48-96 hours after online publication and is updated daily on week days.
Initial download of the metrics may take a while.