Fig. 13
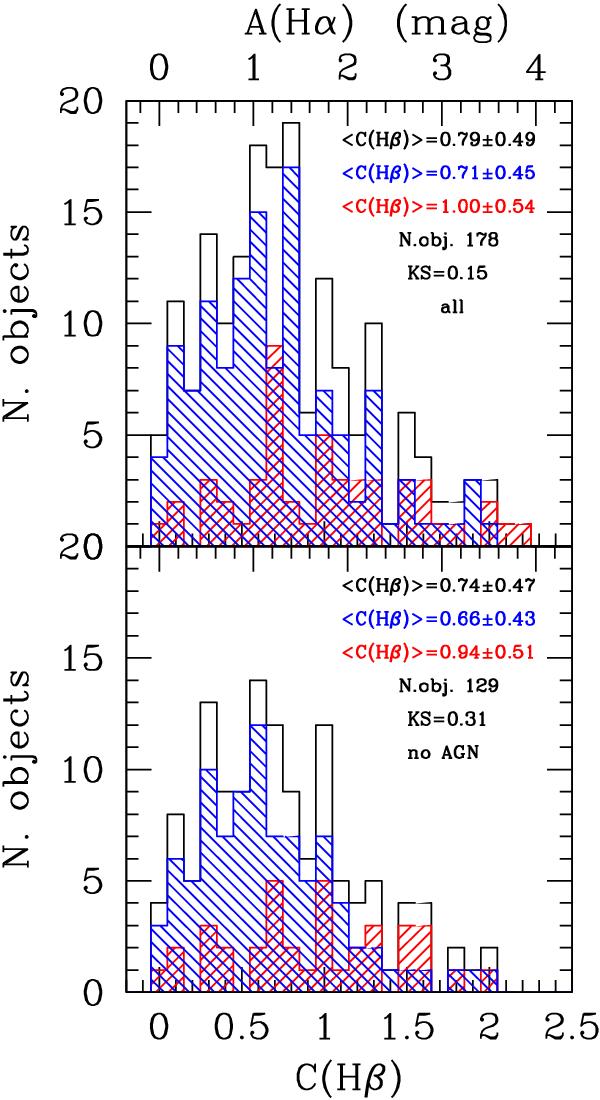
The distribution of the Balmer decrement C(Hβ) or A(Hα) for the whole the HRS sample (above) and excluding AGNs (below). The black line indicates the whole sample of late-type galaxies, the blue line that of galaxies with a normal HI gas content (HI − def ≤ 0.4) and the red one that of HI-deficient Virgo cluster objects (HI − def > 0.4).
Current usage metrics show cumulative count of Article Views (full-text article views including HTML views, PDF and ePub downloads, according to the available data) and Abstracts Views on Vision4Press platform.
Data correspond to usage on the plateform after 2015. The current usage metrics is available 48-96 hours after online publication and is updated daily on week days.
Initial download of the metrics may take a while.