Fig. 11
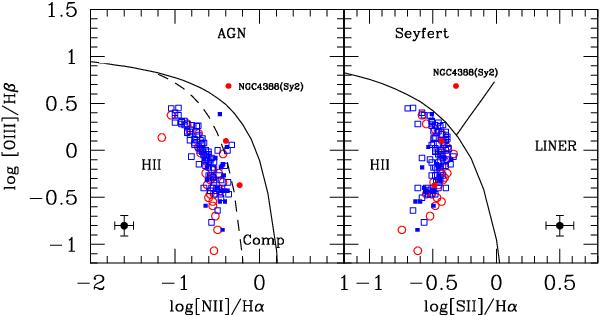
The emission line diagnostic diagrams [Oiii]λ5007/Hβ vs. [Nii]λ6584/Hα and [Oiii]λ5007/Hβ vs. [Sii]λ6717-6731/Hα for all HRS galaxies. The solid and dashed lines gives the limits between star forming (HII), active (AGN, Seyfert, LINER) and composite galaxies of Kewley & Ellison (2008). Blue symbols are for galaxies with a normal HI gas content (HI − def ≤ 0.4), red symbols for HI-deficient objects (HI − def > 0.4). Filled symbols are for galaxies hosting an AGN.
Current usage metrics show cumulative count of Article Views (full-text article views including HTML views, PDF and ePub downloads, according to the available data) and Abstracts Views on Vision4Press platform.
Data correspond to usage on the plateform after 2015. The current usage metrics is available 48-96 hours after online publication and is updated daily on week days.
Initial download of the metrics may take a while.