Fig. 10
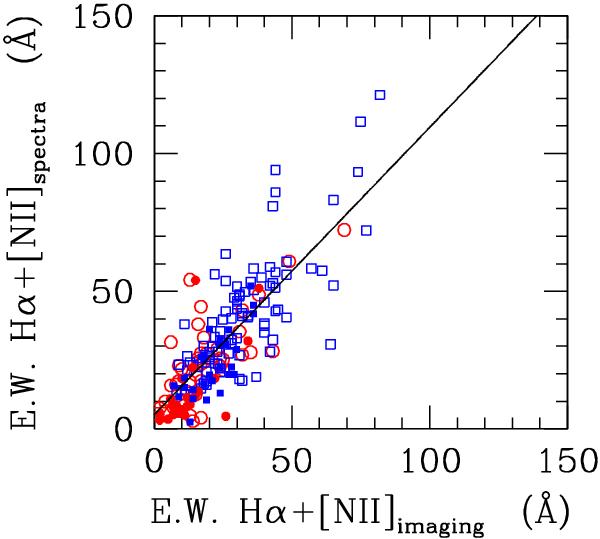
The comparison between the EW Hα+[Nii] obtained in our spectroscopic survey with those obtained in imaging mode by Boselli et al. (in prep.) for 198 galaxies in common. Blue crosses are for star forming galaxies with a normal HI gas content (HI − def ≤ 0.4), open red circles for HI-deficient objects (HI − def > 0.4). Filled symbols indicate galaxies hosting an AGN. The solid line shows the linear fit EW Hα+[Nii]spectra = 1.040( ± 0.058)EW Hα+[Nii]imaging + 5.370( ± 1.766) (r = 0.79). The typical uncertainty in the equivalent width measured from spectroscopic data is 12 − 18%, in imaging mode is ∼ 20%.
Current usage metrics show cumulative count of Article Views (full-text article views including HTML views, PDF and ePub downloads, according to the available data) and Abstracts Views on Vision4Press platform.
Data correspond to usage on the plateform after 2015. The current usage metrics is available 48-96 hours after online publication and is updated daily on week days.
Initial download of the metrics may take a while.