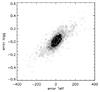
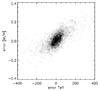
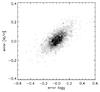
Fig. 3

Error ellipses computed as the difference between the input and the derived parameters of our pipeline, for the set of 2000 spectra of Sect. 3, with SNR ~ 10. These figures illustrate the extent of the correlation of the uncertainties in our parameter derivations. The 2-dimensional histograms have been obtained by binning by 16 K in effective temperature, 0.025 dex in log g and 0.016 dex in [M/H]. The isocontours are for 2, 5, 15 and 30 stars.
Current usage metrics show cumulative count of Article Views (full-text article views including HTML views, PDF and ePub downloads, according to the available data) and Abstracts Views on Vision4Press platform.
Data correspond to usage on the plateform after 2015. The current usage metrics is available 48-96 hours after online publication and is updated daily on week days.
Initial download of the metrics may take a while.