Free Access
Fig. 11
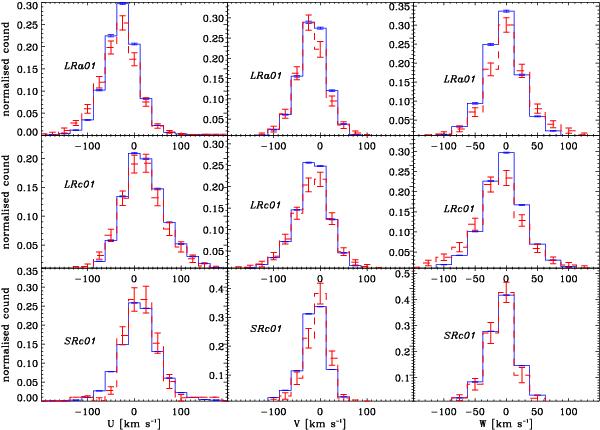
Kinematic comparison (three velocity components) of our observed sample with the BGM1 simulations for the three CoRoT fields. The observations are represented with a red dashed line and the BGM1 data with a solid blue line.
Current usage metrics show cumulative count of Article Views (full-text article views including HTML views, PDF and ePub downloads, according to the available data) and Abstracts Views on Vision4Press platform.
Data correspond to usage on the plateform after 2015. The current usage metrics is available 48-96 hours after online publication and is updated daily on week days.
Initial download of the metrics may take a while.