Fig. 1
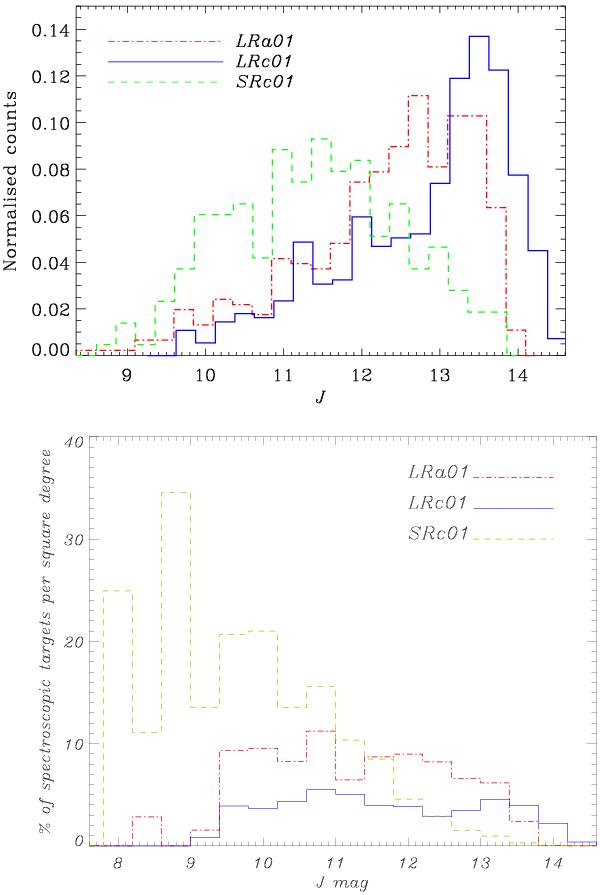
Properties of stars analysed in this study in each of the three pointing directions. Top: distribution of the J magnitudes of the spectroscopic sample normalised to the total number of targets. Bottom: distribution of the J magnitudes of our spectroscopic targets given in percentage of the overall population in the corresponding CoRoT/exoplanet field. The red dotted-dashed represents LRa01 stars, the blue solid line stands for LRc01 stars, and SRc01 is shown with a long-dashed green line.
Current usage metrics show cumulative count of Article Views (full-text article views including HTML views, PDF and ePub downloads, according to the available data) and Abstracts Views on Vision4Press platform.
Data correspond to usage on the plateform after 2015. The current usage metrics is available 48-96 hours after online publication and is updated daily on week days.
Initial download of the metrics may take a while.