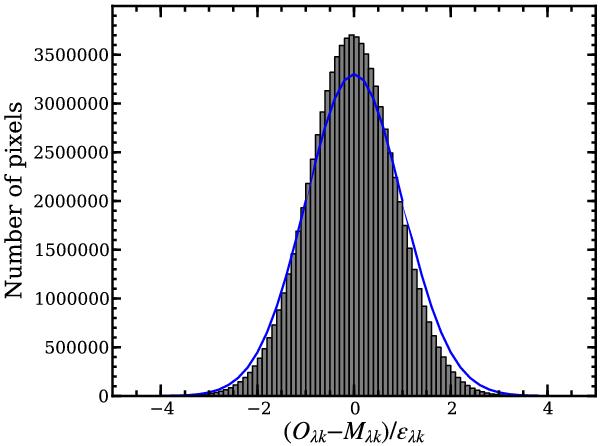
Fig. 9

Histogram of the observed (Oλk) minus model (Mλk) residuals at each wavelength normalized by the formal flux error (ϵλk). The model spectra are obtained from Starlight fits for the stellar continuum, excluding the main emission lines, as well as bad pixels. The histogram describes almost a Gaussian centered at 0 with a dispersion of ~0.8. The blue line indicates a Gaussian distribution centered at 0 with a dispersion of 1, normalized to the total number of pixels for comparison. On the assumption that the spectral residuals are due to noise (i.e., neglecting model imperfections), this figure demonstrates that the pipeline error estimates are reliable.
Current usage metrics show cumulative count of Article Views (full-text article views including HTML views, PDF and ePub downloads, according to the available data) and Abstracts Views on Vision4Press platform.
Data correspond to usage on the plateform after 2015. The current usage metrics is available 48-96 hours after online publication and is updated daily on week days.
Initial download of the metrics may take a while.


