Fig. A.5
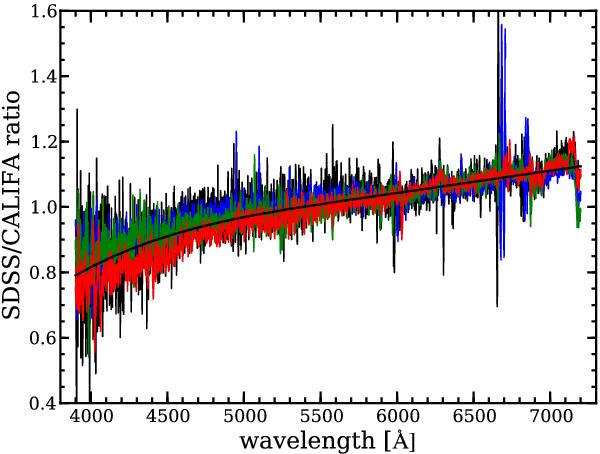
The relative blue-to-red ratio between SDSS spectra and observed CALIFA V500 galaxy spectra (matched to the SDSS fiber aperture) along wavelength. All CALIFA spectra shown were obtained during the photometric night (2012 January 20th) and flux calibrated using the single pointing standard star observation of that night. A fourth order polynomial functions is sufficient to describe the trend presumably originating from the aperture losses of the standard star observation.
Current usage metrics show cumulative count of Article Views (full-text article views including HTML views, PDF and ePub downloads, according to the available data) and Abstracts Views on Vision4Press platform.
Data correspond to usage on the plateform after 2015. The current usage metrics is available 48-96 hours after online publication and is updated daily on week days.
Initial download of the metrics may take a while.