Fig. A.4
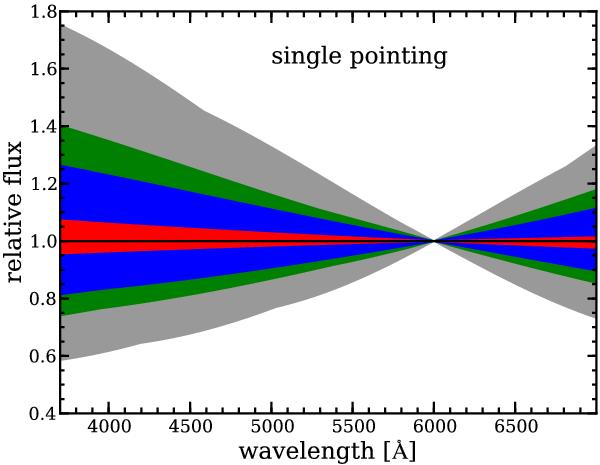
Relative sensitivity curves normalized at 6000 Å from simulated (noise free) standard star observations with PPak at a seeing of 1.2′′. Single pointing observations were simulated for a grid of pointing positions in α and δ with respect to the standard star. Simulations were performed for airmasses of 1.5 (gray), 1.3 (green), 1.1 (blue), and 1.0 (red) to take into account the change in the differential atmospheric refraction. The blue-to-red photometric calibration accuracy achievable is not sufficient even at low airmasses simply because of wavelength dependent aperture losses.
Current usage metrics show cumulative count of Article Views (full-text article views including HTML views, PDF and ePub downloads, according to the available data) and Abstracts Views on Vision4Press platform.
Data correspond to usage on the plateform after 2015. The current usage metrics is available 48-96 hours after online publication and is updated daily on week days.
Initial download of the metrics may take a while.