Fig. A.2
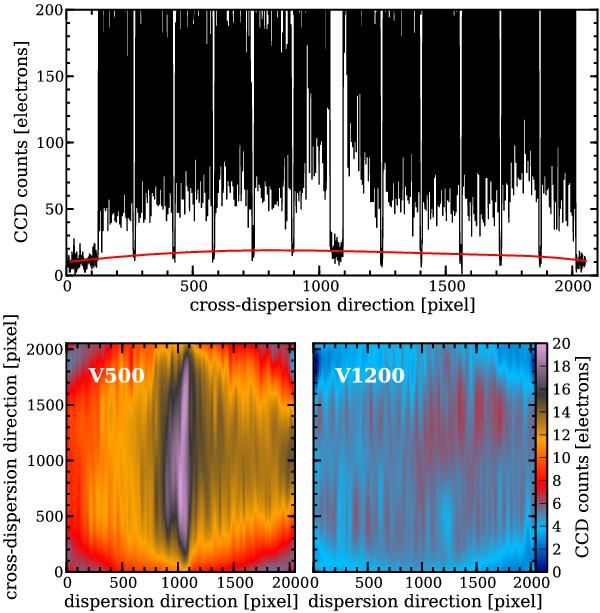
Example of the straylight subtraction process. Top panel: pixel counts along a CCD cross-dispersion cut of the science observation. A sixth order polynomial fit only through the gaps between the fiber bundles is shown as the red line. Bottom panel: straylight maps for the V500 and V1200 data, respectively, reconstructed from the polynomial fit for each cross-dispersion slice of the CCD and smoothed by a 2D Gaussian filter with a 20 pixel width.
Current usage metrics show cumulative count of Article Views (full-text article views including HTML views, PDF and ePub downloads, according to the available data) and Abstracts Views on Vision4Press platform.
Data correspond to usage on the plateform after 2015. The current usage metrics is available 48-96 hours after online publication and is updated daily on week days.
Initial download of the metrics may take a while.