Fig. 20
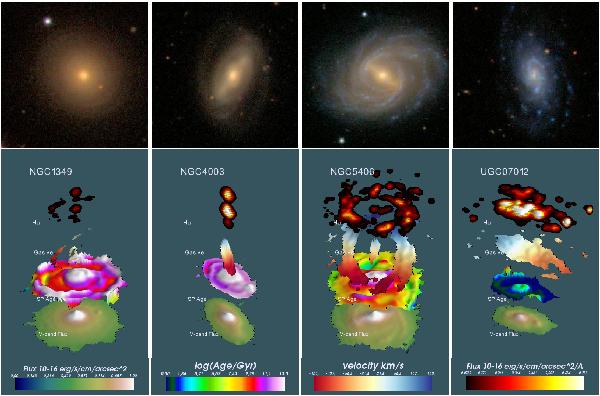
Top panels: SDSS postage stamp images of CALIFA target galaxies, with a FoV of 90″ × 90″. Bottom panels: corresponding examples of quick-look CALIFA 3D visualization images shown on the CALIFA Galaxy Explorer page for four representative galaxies. From bottom to top it shows the reconstructed V band light distribution, the stellar population luminosity-weighted age distribution, the Hα gas velocity field, and the Hα+[N ii] λλ6543,6584 emission-line 3D distribution inferred from the CALIFA V500 datacube. The associated color bars are shown below from left to right.
Current usage metrics show cumulative count of Article Views (full-text article views including HTML views, PDF and ePub downloads, according to the available data) and Abstracts Views on Vision4Press platform.
Data correspond to usage on the plateform after 2015. The current usage metrics is available 48-96 hours after online publication and is updated daily on week days.
Initial download of the metrics may take a while.