Fig. 2
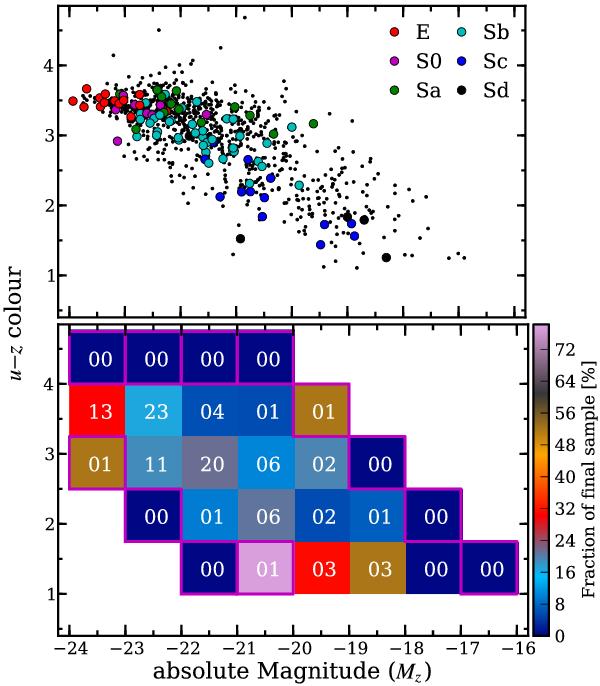
Upper panel: distribution of CALIFA galaxies in the u − z vs. Mz color–magnitude diagram. Black dots indicate galaxies in the CALIFA mother sample (S12, W12) and colored symbols denote CALIFA DR1 galaxies. Different colors represent the morphological classification of galaxies which range from ellipticals (E) to late-type spirals (Sd). Lower panel: the fraction of galaxies in the DR1 sample with respect to the expected final CALIFA sample distribution in bins of 1 mag in Mz and 0.75 mag in u − z. The total number of galaxies per bin in the DR1 sample is written in each bin. The bins for which the number of galaxies in the mother sample is less than 5 are prone to low-number statistics and enclosed by a magenta square for clarity.
Current usage metrics show cumulative count of Article Views (full-text article views including HTML views, PDF and ePub downloads, according to the available data) and Abstracts Views on Vision4Press platform.
Data correspond to usage on the plateform after 2015. The current usage metrics is available 48-96 hours after online publication and is updated daily on week days.
Initial download of the metrics may take a while.