Fig. 16
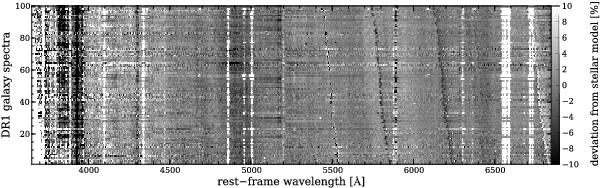
Stack of 100 DR1 central-region spectra in the rest-frame, sorted by redshift. Shown are the residuals after subtraction of the best-fitting stellar population model with Starlight. Systematic deviations from a idealized model can be seen as vertical stripes (rest-frame mismatches, e.g. imperfect stellar model or emission lines), slanted stripes (observed-frame mismatches, e.g. imperfect sky model) or general blue-to-red features (imperfect relative flux calibration with respect to SDSS).
Current usage metrics show cumulative count of Article Views (full-text article views including HTML views, PDF and ePub downloads, according to the available data) and Abstracts Views on Vision4Press platform.
Data correspond to usage on the plateform after 2015. The current usage metrics is available 48-96 hours after online publication and is updated daily on week days.
Initial download of the metrics may take a while.