Fig. 14
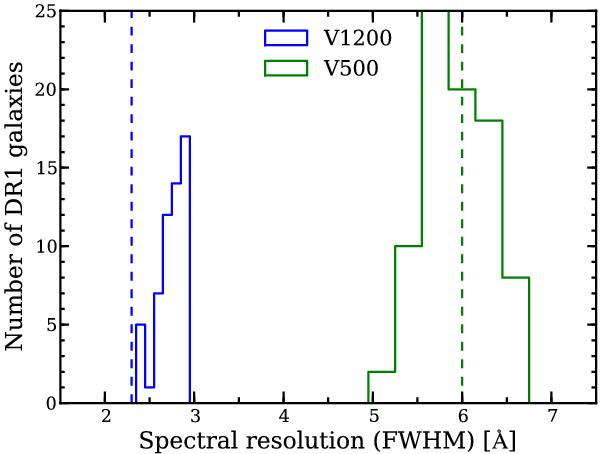
Distribution of the final spectral resolution (FWHM) in the combined cubes as measured from the sky lines in the error cube. The vertical dashed lines indicate the spectral resolution to which the spectra were aimed to be homogenized during the data reduction. Measurements for V1200 (blue, left) are upper limits since the night sky lines used are intrinsically resolved at this level. The spread is due to uncertainties in calculating the spectral resolution from only a few available lines.
Current usage metrics show cumulative count of Article Views (full-text article views including HTML views, PDF and ePub downloads, according to the available data) and Abstracts Views on Vision4Press platform.
Data correspond to usage on the plateform after 2015. The current usage metrics is available 48-96 hours after online publication and is updated daily on week days.
Initial download of the metrics may take a while.