Fig. 13
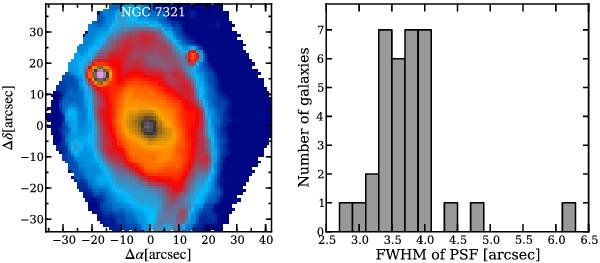
Left panel: V band image of NGC 7321, an example of a CALIFA galaxy with a star in the FoV to measure the PSF of the data. Right panel: distribution of the FWHM of the CALIFA PSF as measured from 34 cubes with a sufficiently bright star in the field. The median of the distribution is 3 7; the spread of values is due to the flux of the underlying galaxy structure and undersampling of the stellar image and hence high-value outliers are upper limits in these cases.
Current usage metrics show cumulative count of Article Views (full-text article views including HTML views, PDF and ePub downloads, according to the available data) and Abstracts Views on Vision4Press platform.
Data correspond to usage on the plateform after 2015. The current usage metrics is available 48-96 hours after online publication and is updated daily on week days.
Initial download of the metrics may take a while.